Dear Future Math Analysis Student,
If you want to pass the class, I advise you to look into any suggestions I may have for you. To be the most successful in this course, you need to be open to change, as Mrs. Kirch always says. This is because the classroom you are about to adapt to is called the flipped classroom, where we learn most of the material we would normally learn in class at home by watching videos. At first I didn't know if I was going to adapt well to this new style of learning but I wasn't going to fail the class. So I gave it a try and it was a big success. If you really want to be successful this year, do all your work right and completely. Take all your quizzes ahead of time and get your wsq chart signed off early. Also, always ask for help whenever you need it because that is what the flipped clasroom is designed to do. Mrs. Kirch is always going to be there whenever you need assistance. So don't worry.
To adjust to the flipped classroom in the best way possible, do everything on time and do all the work, because all the practice will surely benefit you when you take the test. Also, try to enjoy the class for a while because most of the time, you'll be working in groups in which you can collaborate in. Despite small distractions and little things here and there, my group definitely adjusted and had a great time doing so. Just be open to change because that's what's going to be your success.
Unlike previous math classes you may have taken, this class does the opposite. Because we are able to learn at home and collaborate at school, your skills increase and you are able to apply what you know to reality better. You will create a blog, turn in online submissions and make tons of videos all so you can learn in the best way possible. You will use technology more in this class, increasing your skills in this field at the same time as learning new math. Overall, have a positive attitude when making the change and try to enjoy it a bit. I know I did. :)
-Carlos
PS here's a video that can help clear up any confusion
Thursday, June 6, 2013
Tuesday, June 4, 2013
Unit V Big Questions
The formula for the difference quotient comes from the derivative, that represents a formula which tells us the slope of the line that is tangent to any graph at any point. So, to get to the derivative, we must first evaluate the difference quotient. To do this, we find f(x+h), simplify f(x+h)-f(x), and divide the result from the previous step by h. Also, the slope of tangent line to a graph is the same as saying the derivative of a graph because the slope and tangent of a graph are on a and the same. To find the derivative, we evaluate the difference quotient as h approaches 0. Now, when we say the derivative, we say f prime of x (f'(x)) because this is a new equation. To find the slope of the tangent line to f(x) at a specific point, we find the derivative and plug in the x value of the point whose slope of the tangent line we are looking for. To find the equation of the tangent line at a specific point, we go even further and take the slope of the point given at the tangent line and use y=mx+b and find the whole equation with what we have. To find when the tangent line is horizontal, we find the first derivative of f(x), set it equal to zero to represent when the slope of f(x) is horizontal (0) and solve the resulting equation and get values of x where the tangent line would be horizontal.


Monday, May 27, 2013
Unit U Big Questions
1) What is continuity? What is discontinuity?
Continuity is when something does not stop or is not interrupted by anything. A continuous function is predictable. It has no breaks in the graph, no holes, and no jumps. A function that is continuous can be drawn with a single, unbroken pencil stroke. In terms of limits, a function is continuous if the limit as x approaches a number of f(x) is equal to the height f(x) reaches at that point.

As you see above, this function goes on forever in both directions and is not interrupted by anything, meaning there are no jumps, holes, or breaks in the graph to disturb the continuity.
What is discontinuity?
Discontinuity is when something doesn't go on forever in both directions and is not continuous. There are two families of discontinuous functions. They are removable and non-removable discontinuities. The removable discontinuity is just called point discontinuity, also known as a hole. The non-removable discontinuities are jump discontinuity, oscillating behavior, and infinite discontinuity, which is known as unbounded behavior and occurs where there is a vertical asymptote.
Removable:
 Non-removable:

2) What is a limit? When does a limit exist? When does a limit not exist? What is the difference between a limit and a value?
A limit is the intended height of a function. The limit as x approaches 2 of f(x^2) is 4, for example. Even if there is a hole in the function, the limit still exists because the graph still intends to reach a certain height. A limit exists as long as you reach the same height from both the left and the right. The right hand limit is denoted with a +sign after the approached number and the left hand limit is denoted with a -sign after the approached number, in the notation of course. In order for a limit to exist, both the right hand limit and the left hand limit must be the same. If a graph doesn't break at a given value, a limit exists there.
Limits don't exist at the three non-removable discontinuities. Whenever a graph approaches different values from the left and the right, the limit does not exist.
 Here, at certain points in the graph, the limit both exists and doesn't exist. At a2, the limit exists while at a4, the limit doesn't exist.
The difference between a limit and a value is for example, in the photo above, the limit and the value are the same at a2 but are different at a3. At a3, the limit exists because it is the intended height of the function but the value doesn't because there is a hole. The limit is the intended height of the function while a value is the actual point.
3) How do we evaluate limits numerically, graphically, and algebraically?
We evaluate limits numerically by using a table. With the table, we find the intended heights of the whole function.
.JPG) To evaluate limits graphically, we plug in our function into the y= screen on our graphing calculator, hit trace, and trace to the value we are looking for. If you hit trace and you don't get a value, the limit does not exist and the reasons for that situation are all above.
To evaluate limits graphically, we plug in our function into the y= screen on our graphing calculator, hit trace, and trace to the value we are looking for. If you hit trace and you don't get a value, the limit does not exist and the reasons for that situation are all above.
Lastly, we evaluate limits algebraically by using three different methods. These methods are the direct substitution method, the dividing out/factoring method, and the conjugate method (rationalizing method). The cool thing about these methods is that they go in order in a sort of last resort sort of way. If substitution doesn't work, we resort to the factoring method. If the factoring method doesn't work, we go to the rationalizing/conjugate method, which should always work. All of these methods are self-explanatory.
*Sometimes we will wan to find the limit of a function as x is getting bigger and bigger (approaching positive infinity) or smaller and smaller (approaching negative infinity). If we try to use direct substitution, we get to what is called indeterminate form. From there, we divide every term in the numerator and denominator by the highest power of x in the denominator to determine the limit. It's actually quite simple, really.
Continuity is when something does not stop or is not interrupted by anything. A continuous function is predictable. It has no breaks in the graph, no holes, and no jumps. A function that is continuous can be drawn with a single, unbroken pencil stroke. In terms of limits, a function is continuous if the limit as x approaches a number of f(x) is equal to the height f(x) reaches at that point.
As you see above, this function goes on forever in both directions and is not interrupted by anything, meaning there are no jumps, holes, or breaks in the graph to disturb the continuity.
What is discontinuity?
Discontinuity is when something doesn't go on forever in both directions and is not continuous. There are two families of discontinuous functions. They are removable and non-removable discontinuities. The removable discontinuity is just called point discontinuity, also known as a hole. The non-removable discontinuities are jump discontinuity, oscillating behavior, and infinite discontinuity, which is known as unbounded behavior and occurs where there is a vertical asymptote.
Removable:

2) What is a limit? When does a limit exist? When does a limit not exist? What is the difference between a limit and a value?
A limit is the intended height of a function. The limit as x approaches 2 of f(x^2) is 4, for example. Even if there is a hole in the function, the limit still exists because the graph still intends to reach a certain height. A limit exists as long as you reach the same height from both the left and the right. The right hand limit is denoted with a +sign after the approached number and the left hand limit is denoted with a -sign after the approached number, in the notation of course. In order for a limit to exist, both the right hand limit and the left hand limit must be the same. If a graph doesn't break at a given value, a limit exists there.
Limits don't exist at the three non-removable discontinuities. Whenever a graph approaches different values from the left and the right, the limit does not exist.
The difference between a limit and a value is for example, in the photo above, the limit and the value are the same at a2 but are different at a3. At a3, the limit exists because it is the intended height of the function but the value doesn't because there is a hole. The limit is the intended height of the function while a value is the actual point.
3) How do we evaluate limits numerically, graphically, and algebraically?
We evaluate limits numerically by using a table. With the table, we find the intended heights of the whole function.
.JPG)
Lastly, we evaluate limits algebraically by using three different methods. These methods are the direct substitution method, the dividing out/factoring method, and the conjugate method (rationalizing method). The cool thing about these methods is that they go in order in a sort of last resort sort of way. If substitution doesn't work, we resort to the factoring method. If the factoring method doesn't work, we go to the rationalizing/conjugate method, which should always work. All of these methods are self-explanatory.
*Sometimes we will wan to find the limit of a function as x is getting bigger and bigger (approaching positive infinity) or smaller and smaller (approaching negative infinity). If we try to use direct substitution, we get to what is called indeterminate form. From there, we divide every term in the numerator and denominator by the highest power of x in the denominator to determine the limit. It's actually quite simple, really.
Cited Evidence:
Thursday, April 25, 2013
Unit T Big Question Blog Post #4
4) Why do sine and cosine not have asymptotes, but the other four trig graphs do? Use unit circle ratios to explain.
Sine and cosine do not have asymptotes because they are a wave when they are shown fully and they run forever on the x-axis. Also, cosine, in unit circle terms, is x/r and since r is always 1, cosine can never be undefined since r can never be zero, which is what makes a function undefined: when the denominator is zero. The same goes for sine. In unit circle terms, sine is y/r and since r is always 1, sine can never be undefined since r can never be zero, which is what is needed if you want to result in an asymptote: the denominator would have to be zero.
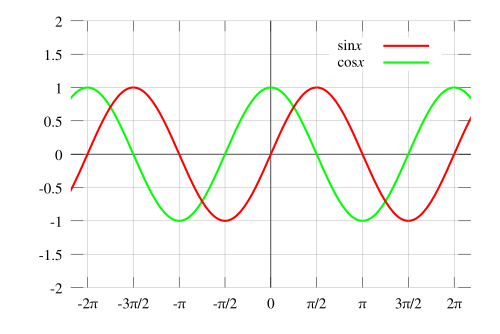
Secant, cosecant, tangent, and cotangent all have asymptotes of how x and y are zero in this case. Secant is 1/cos which is r/x. X can be any number and when it is zero, secant automatically becomes undefined and and asymptote is produced. The same goes for cosecant, which is r/y, except that when y is 0, cosecant becomes undefined and has an asymptote.
Tangent is sin/cos so when cosine is 0, it becomes undefined and produces an asymptote. Same goes for cotangent except that since cotangent is cos/sin, when sine is 0, cotangent becomes undefined and results in an asymptote. Overall, the theme is common: depending on the ratios from the functions, certain functions can never have asymptotes and others can.

Sources: http://en.wikibooks.org/wiki/Trigonometry/Graphs_of_Sine_and_Cosine_Functions
http://en.wikipedia.org/wiki/File:Trigonometric_functions.svg
Sine and cosine do not have asymptotes because they are a wave when they are shown fully and they run forever on the x-axis. Also, cosine, in unit circle terms, is x/r and since r is always 1, cosine can never be undefined since r can never be zero, which is what makes a function undefined: when the denominator is zero. The same goes for sine. In unit circle terms, sine is y/r and since r is always 1, sine can never be undefined since r can never be zero, which is what is needed if you want to result in an asymptote: the denominator would have to be zero.
Secant, cosecant, tangent, and cotangent all have asymptotes of how x and y are zero in this case. Secant is 1/cos which is r/x. X can be any number and when it is zero, secant automatically becomes undefined and and asymptote is produced. The same goes for cosecant, which is r/y, except that when y is 0, cosecant becomes undefined and has an asymptote.
Tangent is sin/cos so when cosine is 0, it becomes undefined and produces an asymptote. Same goes for cotangent except that since cotangent is cos/sin, when sine is 0, cotangent becomes undefined and results in an asymptote. Overall, the theme is common: depending on the ratios from the functions, certain functions can never have asymptotes and others can.
Sources: http://en.wikibooks.org/wiki/Trigonometry/Graphs_of_Sine_and_Cosine_Functions
http://en.wikipedia.org/wiki/File:Trigonometric_functions.svg
Wednesday, April 24, 2013
Unit T Big Question Blog Post #3
3) Why is a normal tangent graph uphill, but a normal cotangent graph downhill? Use the unit circle ratios to explain.

.
According to the unit circle, tangent is positive in the first and third quadrants which is why on the graph, tangent is above the x axis (positive) from 0 to pi/2 and pi to 3pi/2. Also, because the asymptotes for tangent are pi/2 and 3pi/2, it can explain why tangent is going towards those asymptotes meaning that because tangent stops being positive at the end of the first quadrant, it goes toward the asymptote to finish the cycle, and then starts going negative to start the second quadrant and so on. Tangent is in red and since red is going uphill, along with this explanation, that is why a normal tangent graph is uphill.
According to the unit circle, cotangent is positive in the first and third quadrants which is why on the graph, cotangent is above the x axis (positive) from 0 to pi/2 and pi to 3pi/2. Also, because the asymptotes for cotangent are 0 and pi, it can explain why cotangent is going towards those asymptotes, meaning that because cotangent stops being positive at the end of the first quadrant, it goes toward the asymptote to finish the cycle, and then starts going negative to start the second quadrant and so on. Cotangent is in blue and since blue is going downhill, along with this explanation, that is why a normal cotangent graph is downhill. The reason why it is downhill is also because it is the inverse of tangent so the direction is almost like a mirror image going in a different direction since they are reciprocals of each other.
Source:http://www.cartage.org.lb/en/themes/Sciences/Mathematics/Trigonometry/differentfund/different%20Functions%20.html
Unit T Big Question Blog Post #2
2) How do the graphs of sine and cosine relate to each of the others? Emphasize asymptotes in your response.
Well, sine and cosine don't have asymptotes but the rest of the trig functions do have asymptotes because at certain marks on the graph, sine can be 0 and cosine can be 0. These two functions relate to the others because all of the others have sine and/or cosine within them in one way or another.
a) tangent. tangent is sine/cosine. When cosine is 0, that means that the trig function is undefined so there is an asymptote. Tangent's asymptotes are at pi/2 and 3pi/2.

b) cotangent: cotangent is the inverse of tangent which means because tangent is sine/cosine, cotangent is cosine/sine. When sine is 0, there is an asymptote because of how the whole thing is made undefined at that particular moment. Tangent's asymptotes are at pi/2 and 3pi/2 so, to contrast, this means that cotangent's asymptotes are at 0 and pi. Using the graphs, notice how the asymptotes of the graph of y = tan(x) are the x-intercepts of the graph of y = cot(x). There are vertical asymptotes at each end of the cycle. The asymptote that occurs at repeats every
units
repeats every
units

c) secant: secant is the inverse of cosine which means that it is 1/cosine and when cosine is 0 in this case, secant becomes undefined as a whole since it is the reciprocal of cosine. Anytime we have an undefined as our answer, we automatically know that there is going to be an asymptote. There are vertical asymptotes. The asymptote that occurs at repeats every
units
repeats every
units


the pink is the parent graph of cosine and the brown is secant.
d) cosecant: cosecant is the reciprocal of sine making cosecant 1/sine. So, when sine is zero in this case, cosecant becomes undefined anytime sine is zero, thus resulting in an asymptote. The x-intercepts of y = sin x are the asymptotes for y = csc x. There are vertical asymptotes. The asymptote that occurs at
repeats every
units


the brown is the cosecant graph and the blue is the parent graph of sine.
Excellent Source: http://www.regentsprep.org/Regents/math/algtrig/ATT7/othergraphs.htm
Well, sine and cosine don't have asymptotes but the rest of the trig functions do have asymptotes because at certain marks on the graph, sine can be 0 and cosine can be 0. These two functions relate to the others because all of the others have sine and/or cosine within them in one way or another.
a) tangent. tangent is sine/cosine. When cosine is 0, that means that the trig function is undefined so there is an asymptote. Tangent's asymptotes are at pi/2 and 3pi/2.
b) cotangent: cotangent is the inverse of tangent which means because tangent is sine/cosine, cotangent is cosine/sine. When sine is 0, there is an asymptote because of how the whole thing is made undefined at that particular moment. Tangent's asymptotes are at pi/2 and 3pi/2 so, to contrast, this means that cotangent's asymptotes are at 0 and pi. Using the graphs, notice how the asymptotes of the graph of y = tan(x) are the x-intercepts of the graph of y = cot(x). There are vertical asymptotes at each end of the cycle. The asymptote that occurs at
repeats every
units c) secant: secant is the inverse of cosine which means that it is 1/cosine and when cosine is 0 in this case, secant becomes undefined as a whole since it is the reciprocal of cosine. Anytime we have an undefined as our answer, we automatically know that there is going to be an asymptote. There are vertical asymptotes. The asymptote that occurs at
repeats every
units the pink is the parent graph of cosine and the brown is secant.
d) cosecant: cosecant is the reciprocal of sine making cosecant 1/sine. So, when sine is zero in this case, cosecant becomes undefined anytime sine is zero, thus resulting in an asymptote. The x-intercepts of y = sin x are the asymptotes for y = csc x. There are vertical asymptotes. The asymptote that occurs at
repeats every
unitsthe brown is the cosecant graph and the blue is the parent graph of sine.
Excellent Source: http://www.regentsprep.org/Regents/math/algtrig/ATT7/othergraphs.htm
Unit T Big Question Blog Post #1
1) How do the trig graphs relate to the unit circle?
a) Period?-Why is the period for sine and cosine 2pi, whereas the period for tangent and cotangent is pi?
Well for sine and cosine, they have a period of 2pi because for both, their pattern of being positive or negative doesn't repeat until after four marks. On the unit circle, our quadrant angles (0,90,180,270, 360) in radians are 0, pi/2, pi, 3pi/2, and 2pi. Sine is positive in quadrant 1 and quadrant 2, thus meaning that it is negative in quadrant 3 and 4 which makes the pattern + + - -. Cosine is positive in quadrant 1 and quadrant 4, thus meaning that it is negative in quadrant 2 and 3 which makes thee pattern + - - +. As you can see, on the unit circle, the pattern for these two trig functions repeats only after one full revolution and since one revolution around the unit circle is 360 degrees, it has a period of 2pi. The same is on the graph except that the graph shows the unit circle in a different form on the x-axis. One period on a graph is like saying one revolution on the unit circle.

Source: http://www.upv.es/~rfuster/xpicture/functiongraphs.html
However, tangent and cotangent have a period of pi because their pattern of being positive or negative only repeats after two marks, or half of a revolution. Tangent is positive in quadrant 1 and 3 and is negative in quadrant 2 and 4. Cotangent is the same. This means that the pattern is + - + -. According to the graph, you can notice after every two marks, tangent repeats.

Source: http://www.analyzemath.com/trigonometry/properties.html
b) Amplitude?-How does the fact that sine and cosine have amplitudes of one (and the other trig functions don't have amplitudes) relate to what we know about the unit circle?
First of all, sine and cosine have amplitudes of one because that is where the minimum and maximum points are, meaning that unlike the domain on a sine/cosine graph, the range is specific. The domain is all real numbers.Unlike sine and cosine, tangent and the rest of the trig functions have asymptotes, so when the functions are graphed in between the asymptotes, the vertex indicates where the function begins to go up to infinity or down to negative infinity.

Source: http://math.tutorvista.com/calculus/period-of-a-function.html

source: http://www.education.com/study-help/article/pre-calculus-help-other-trig-functions/
a) Period?-Why is the period for sine and cosine 2pi, whereas the period for tangent and cotangent is pi?
Well for sine and cosine, they have a period of 2pi because for both, their pattern of being positive or negative doesn't repeat until after four marks. On the unit circle, our quadrant angles (0,90,180,270, 360) in radians are 0, pi/2, pi, 3pi/2, and 2pi. Sine is positive in quadrant 1 and quadrant 2, thus meaning that it is negative in quadrant 3 and 4 which makes the pattern + + - -. Cosine is positive in quadrant 1 and quadrant 4, thus meaning that it is negative in quadrant 2 and 3 which makes thee pattern + - - +. As you can see, on the unit circle, the pattern for these two trig functions repeats only after one full revolution and since one revolution around the unit circle is 360 degrees, it has a period of 2pi. The same is on the graph except that the graph shows the unit circle in a different form on the x-axis. One period on a graph is like saying one revolution on the unit circle.
Source: http://www.upv.es/~rfuster/xpicture/functiongraphs.html
However, tangent and cotangent have a period of pi because their pattern of being positive or negative only repeats after two marks, or half of a revolution. Tangent is positive in quadrant 1 and 3 and is negative in quadrant 2 and 4. Cotangent is the same. This means that the pattern is + - + -. According to the graph, you can notice after every two marks, tangent repeats.
Source: http://www.analyzemath.com/trigonometry/properties.html
b) Amplitude?-How does the fact that sine and cosine have amplitudes of one (and the other trig functions don't have amplitudes) relate to what we know about the unit circle?
First of all, sine and cosine have amplitudes of one because that is where the minimum and maximum points are, meaning that unlike the domain on a sine/cosine graph, the range is specific. The domain is all real numbers.Unlike sine and cosine, tangent and the rest of the trig functions have asymptotes, so when the functions are graphed in between the asymptotes, the vertex indicates where the function begins to go up to infinity or down to negative infinity.
Source: http://math.tutorvista.com/calculus/period-of-a-function.html
source: http://www.education.com/study-help/article/pre-calculus-help-other-trig-functions/
Tuesday, April 16, 2013
Student Video Unit S Concept 7
This video is about solving equations with half angle formulas.These formulas include angles which are half of an angle on the unit circle. Depending on which quadrants we are in, sine, cosine, and tangent can all either be positive and/or negative.
What should the reader pay attention to?
The reader should pay attention to the formulas used and why anything squared is always positive. Also, when given radians, you must convert to degrees and find a coterminal angle within 360 degrees, if necessary, before moving on to do anything else.
Unit S Asessment #2: Half Angles and Sum and Difference Formulas


This picture is about half angles and the sum and difference formulas. The Unit Circle is essential in solving for the correct answers. It is also shows methods of simplification and in this case, we are using the sum formula.
What should the reader pay attention to?
The reader should pay attention to how similar the answers can be and how it is important to find the half angle to be able to use the correct formula.The viewer should also pay attention to how this is only an example of a sum formula and not a difference formula, meaning that if we were to use a difference formula, signs and variables would be tweaked (changed) just a bit.
Student Video: Unit S Concept 3
What is this video about?
This video is about using power-reducing formulas. Trigonometric identities and certain formulas are also used. Power reducing formulas, as explained in the video, allow us to lower the degree of a given function until we have simplified enough to the point where our highest degree (power) is one.
What should the reader pay attention to?
The reader should pay attention to how to break down our problem when we are simplifying to get the highest power to be 1. Also, knowing how to find a common denominator is essential for complete simplification. The viewer should also have an appropriate identities chart at hand which suits these type of problems, making them solvable.
Friday, March 29, 2013
Student Problem #10: Unit R Concept 3
1) What is this about?
This is about evaluating trig functions that have inverse trig functions using the sum and difference formulas. The unit circle is also used here.
2) what should the reader pay attention to?
The reader should pat attention to how we replace what's in the parentheses with u and v and how we use that to get to the difference formula. Also, how we use unit circle values to find our answer.
Wednesday, March 27, 2013
Student Problem #9: Unit R Concept 2
Using sum and difference formulas when given values (right triangle)
1) What is this about?
This picture shows two examples from Unit R Concept 2. Here, we use right triangles draw in different quadrants to solve for sine, cosine, and tangent. Depending on which quadrant the triangles are drawn in, the values of these functions will be positive and/or negative.
2) What does the reader need to pay attention to?
The reader needs to pay attention to making sure that the triangles are drawn in the correct quadrants. Also, when finding the missing piece of the triangle, be careful of the signs (left and down is negative, right and up is positive). Lastly, make sure to use the correct sum and difference formulas.
Student Problem #8 Unit R Concept 1
Sum Formulas and Difference Formulas
1) What is this about?
These pictures are about finding the exact values of angles that aren't on the unit circle. We use trigonometric functions which have their own formulas depending on whether two angles are being added or subtracted to add or subtract to the given angle.
2) What does the reader need to pay attention to?
The reader should pay attention to where the coordinates come from as well as how we can derive sine, cosine, and tangent from one coordinate. Also, when finding tangent, we often have to multiply by the conjugate in the process.
Wednesday, March 20, 2013


Monday, March 18, 2013
Math Analysis Reflective Blog Post
1.
How have you performed on the Unit O and P tests? What evidence do you have
from your work in the unit that supports your test grade (good or bad)? Be
specific and include a minimum of three pieces of evidence.
RESPOND
HERE:
To my surprise, I have done ok on the latest test, unit P. I had the mindset that if I wasn't being checked off every so often, that I would not do the work sometimes and that would affect me by bringing my grade down. I did better on the retake for unit O and I also got an A on the unit P. Some evidence could be, in my opinion, the fact that I still have my group to help me as well as all the resources I have been given.
2.
You are able to learn material in a variety of ways in Math Analysis. It
generally follows this pattern:
→
Your initial source of information is generally the video lessons and SSS
packets followed by a processing and reflection activity via the WSQ
→
individual supplemental research online or in the textbook before class
→
reviewing and accessing supplementary resources provided by Mrs. Kirch on the
blog
→
discussion with classmates about key concepts
→
practice of math concepts through PQs
→
formatively assessing your progress through concept quizzes
→
cumulatively reviewing material through PTs
→
Final Assessment via Unit Test.
Talk
through each of the steps given in the following terms:
a.
How seriously do you take this step for your learning? What evidence do you
have to support your claim? Make sure to make reference to all 8
steps.
b.
How could you improve your focus and attention on this step to improve your
mastery of the material? What specific next steps would this entail? Make sure
to make reference to all 8 steps.
RESPOND
HERE:
I take learning very seriously because I have seen that how well I learn reflects how much I can comprehend. I do my best to do all the work so I could understand everything from the moment I pick up the test. During class, I try my best to get the pq's done as well as have time for other assignments. Once I get home, I do my best to convince myself to start the homework right away but sometimes, it doesn't work out. The practice test is alot, especially since it's all the concepts in just a few days. But what I like now is how it's blended in with the practice quizzes. Often, I have difficulty, so when I turn to my group, I'm grateful they can help or else I'd be lost.
3.
Reflect on your learning this year thus far by considering the following
questions:
a.
How confident do you generally feel on the day of a Unit Test? Give evidence
and specifics to back up your answer.
b.
How well do you feel you have learned the math material this year as compared
to your previous years in math? Give evidence to support your
claim.
c.
How DEEPLY do you feel you have learned the math material this year as compared
to your previous years in math? Give evidence to support your
claim.
d.
Do you normally feel like you understand the WHY behind the math and not just
the WHAT/HOW? Meaning, do you understand why things work, how they are
connected to each other, etc, and not just the procedures? Explain your answer
in detail and cite specific evidence from this year.
e.
How does your work ethic relate to your performance and success? What is the
value of work ethic in real life?
RESPOND
HERE: Depending on how much I have practiced, I can go from being really confident to extremely nervous on the day of the test. I was nervous on the unit P test because I didn't go over how to graph piecewise functions but I was grateful I remembered. There is a big gap between how well I have learned math between this year and all other years. Every step is clear to me because I can see where it comes from and why it follows the formula. I have learned the math material so deep this year that I can actually look forward to doing the homework because it means I want to learn whereas in other scenarios, I had to learn. Before, it was hard to see how everything was connected but because of all the reasoning, prcactice, and resources, it's much easier now to see why everything is connected. My work ethic relates to my performance and success in one way: If I am committed to doing my work on time, then I'm moving forward. The value of work ethic in real life is very powerful in the way that it determines where you go. High school is a perfect example: In four years, we learn where we go based on how we have done.
Thursday, March 7, 2013
Monday, February 25, 2013
Tuesday, February 12, 2013
Unit N- Derive the Unit Circle


These pictures show how the the special right triangles correlate with the Unit Circle and how it is derived. The vertices of each of these triangles are on the Unit Circle and in each, it is possible to faintly see how they are depicted on a coordinate plane. The Unit Circle, which has a radius of 1, can help us to find all of its vertices just by knowing the rules of the relationship between side lengths and how different angle measures/arc lengths affect the side lengths.
Friday, February 1, 2013
Conic Sections- Parabola
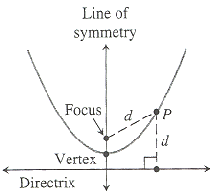
1) A parabola is ant point on a parabola that is at an equal distance from the focus and the vertex,
and the vertex and the directrix. Also, at any point on the parabola,
you can move it around the focus in a way that it creates a parabola
shape.
2) The focus affects the shape of the parabola in the way that wherever the focus is, that is where the parabola will form around. Also, p, which is the distance from the vertex and the focus and the focus and the directrix, if it is positive or negative, the graph will go either up, down, left, or right, depending on what term is squared.
3) These properties affect real life with dishes that are like satellites at a certain museum.One speaks in what is the focus and the sound waves hit the dish at the right angle to travel to the other dish and hits the focus for someone else to hear.
Conic Sections Image: http://www.personal.kent.edu/~rmuhamma/Algorithms/MyAlgorithms/Gifs/parabola-2.gif
Website: http://www.mathwarehouse.com/quadratic/parabola/focus-and-directrix-of-parabola.php
Subscribe to:
Posts (Atom)